Videobserver is always looking to be one step ahead. With that in mind our team is creating and looking for new features to help our customers to step their games and analysis. This time, it’s a big feature, that will take coaches to another level. We proudly present Passes Network.
The Network
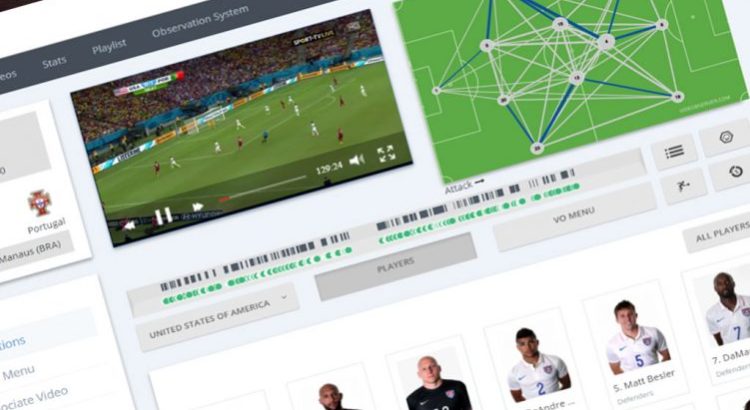
Now you can access this feature in your reports. Just select the players number and click on their position in the field. Then select “Draw Passes” and the network will show up on the field.

This is great in multiple levels – it shows the players that participate the most through the size of the circle and the blue line represents the players with most connections.
Then you can check the relationship between players, sectors, lanes and so on. For example, here you can see the relationship between the defensive sector with the 2 supporting midfielders.

The Data
Also, it can show you the received and made passes of 1 player to every team mate or a group of team mates – like the closest ones for example. The blue line represents the passes made and the orange one, the passes received.

